Qualtrics is an online survey platform similar to SurveyMonkey that is used by researchers to collect data. Until recently, one had to manually download the data in either SPSS or .csv format, making ongoing data analysis difficult to check whether the trend of the incoming data supports the hypothesis.
Jason Bryer has recently developed an R package published to Github for downloading data from Qualtrics within R using the Qualtrics API (see his Github repo). Using this package, you can integrate your Qualtrics data with other experimental data collected in the lab and, by running an Rscript as a cronjob, get daily updates for your analyses in R. I’ll demonstrate the use of this package below.
Installing the Qualtrics Package from Github
1 2 3 4 5 6 7 | |
If you wanted to distribute the Rscript to colleagues with different setups, you would use something like this:
1 2 3 4 5 6 7 8 9 10 11 12 13 14 15 16 | |
Pulling Data from Qualtrics
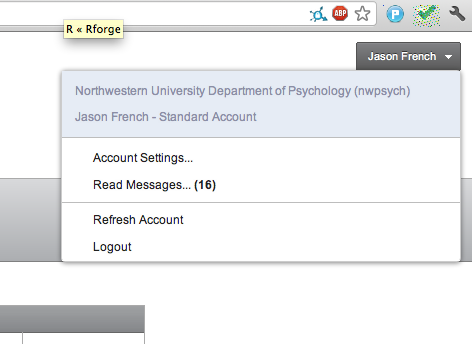
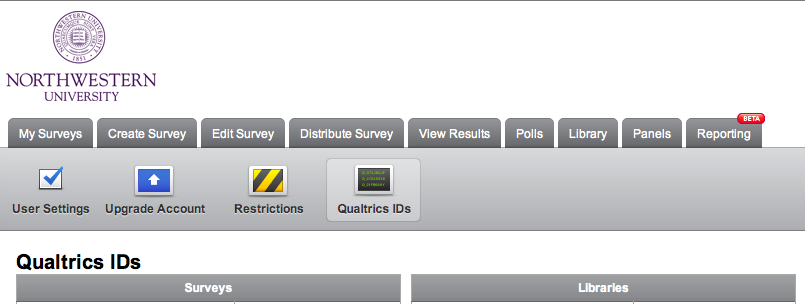
 First, you’ll need to find the Survey ID of the associated study on Qualtrics. Access your
 Account Settings and click on
Qualtrics IDs. From here, copy the entire ID into your R code (e.g., SV_blahblah).

Next, load the qualtrics package in R and pull the data using getSurveyResults(). If you receive an error in R
regarding API permissions, you may need to email support@qualtrics.com and request API access. The
R function accesses your survey using XML.
1 2 3 4 | |
However, readers have pointed out that the resulting data doesn’t have your variable names. Alternatively, Trevor Kvaran points out that you can modify the getSurveyResults function to export the variable names by appending “&ExportTags=1” to the url:
1 2 3 4 5 6 7 8 9 10 11 12 13 14 15 16 17 18 19 20 21 | |
Again, if you are distributing the analysis to collaborators, you may want to use a setup like below, which reads the user and password securely. If you want to automate this, you’ll obviously need hardcode your username and password. At this time, I don’t believe R has a hashing mechanism for passwords like Python, meaning you’ll need to have a plaintext password.
1 2 3 4 5 6 7 8 9 10 11 12 13 14 15 16 | |
Outputting Data using xtable
Now that we have our data pulled from Qualtrics, we can analyze it as if it were a regular R data.frame.
If you know your specific survey variables of interest, you’ll want to modify the code using qualtrics.data[,c('Var1','Var2)].
1 2 3 4 5 6 7 8 9 10 | |
Running an Rscript
In order for your script to be run daily, it needs to be a) marked as executable (see here) and b) added to crontab. First, mark it as executable:
1
| |
Make sure that #!/usr/bin/env Rscript is at the top of your script!
Next, edit the system’s crontab and add the script.
1 2 3 | |